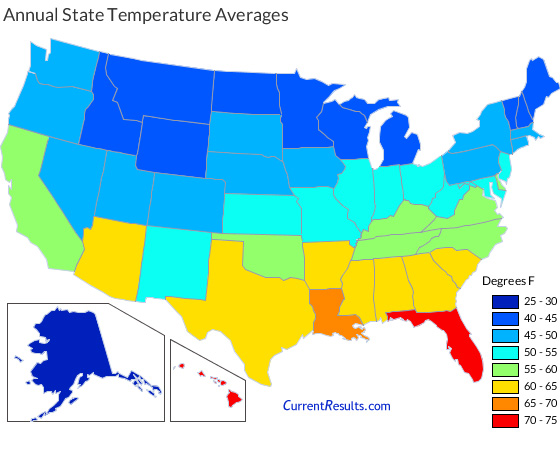
Average Annual Temperature for Each US State
The average temperature for the year in every USA state is listed below. The states are also ranked from the hottest state at number 1 to the coldest state at number 50.
Below the tables there's a map that allows you to visually compare the annual average temperatures among states.
State-wide averages of annual temperatures range from a high of 70.7 degrees Fahrenheit (21.5 degrees Celsius) in Florida to a low of 26.6 °F (-3.0 °C) in Alaska. For the entire United States, excluding Hawaii and Alaska, the year averages 52.7 °F (11.5 °C).
The temperatures are based on data collected by weather stations throughout each state during the years 1971 to 2000 and made available by the NOAA National Climatic Data Center of the United States.
State names are linked to more detailed temperature information for that state.
| State | Avg °F | Avg °C | Rank |
|---|---|---|---|
| Alabama | 62.8 | 17.1 | 7 |
| Alaska | 26.6 | -3.0 | 50 |
| Arizona | 60.3 | 15.7 | 10 |
| Arkansas | 60.4 | 15.8 | 9 |
| California | 59.4 | 15.2 | 12 |
| Colorado | 45.1 | 7.3 | 39 |
| Connecticut | 49.0 | 9.4 | 29 |
| Delaware | 55.3 | 12.9 | 16 |
| Florida | 70.7 | 21.5 | 1 |
| Georgia | 63.5 | 17.5 | 5 |
| Hawaii | 70.0 | 21.1 | 2 |
| Idaho | 44.4 | 6.9 | 40 |
| Illinois | 51.8 | 11.0 | 23 |
| Indiana | 51.7 | 10.9 | 25 |
| Iowa | 47.8 | 8.8 | 36 |
| Kansas | 54.3 | 12.4 | 19 |
| Kentucky | 55.6 | 13.1 | 15 |
| State | Avg °F | Avg °C | Rank |
|---|---|---|---|
| Louisiana | 66.4 | 19.1 | 3 |
| Maine | 41.0 | 5.0 | 48 |
| Maryland | 54.2 | 12.3 | 20 |
| Massachusetts | 47.9 | 8.8 | 35 |
| Michigan | 44.4 | 6.9 | 40 |
| Minnesota | 41.2 | 5.1 | 47 |
| Mississippi | 63.4 | 17.4 | 6 |
| Missouri | 54.5 | 12.5 | 18 |
| Montana | 42.7 | 5.9 | 45 |
| Nebraska | 48.8 | 9.3 | 30 |
| Nevada | 49.9 | 9.9 | 28 |
| New Hampshire | 43.8 | 6.6 | 42 |
| New Jersey | 52.7 | 11.5 | 22 |
| New Mexico | 53.4 | 11.9 | 21 |
| New York | 45.4 | 7.4 | 37 |
| North Carolina | 59.0 | 15.0 | 13 |
| North Dakota | 40.4 | 4.7 | 49 |
| State | Avg °F | Avg °C | Rank |
|---|---|---|---|
| Ohio | 50.7 | 10.4 | 26 |
| Oklahoma | 59.6 | 15.3 | 11 |
| Oregon | 48.4 | 9.1 | 33 |
| Pennsylvania | 48.8 | 9.3 | 30 |
| Rhode Island | 50.1 | 10.1 | 27 |
| South Carolina | 62.4 | 16.9 | 8 |
| South Dakota | 45.2 | 7.3 | 38 |
| Tennessee | 57.6 | 14.2 | 14 |
| Texas | 64.8 | 18.2 | 4 |
| Utah | 48.6 | 9.2 | 32 |
| Vermont | 42.9 | 6.1 | 44 |
| Virginia | 55.1 | 12.8 | 17 |
| Washington | 48.3 | 9.1 | 34 |
| West Virginia | 51.8 | 11.0 | 23 |
| Wisconsin | 43.1 | 6.2 | 43 |
| Wyoming | 42.0 | 5.6 | 46 |
